Data Point Viewer
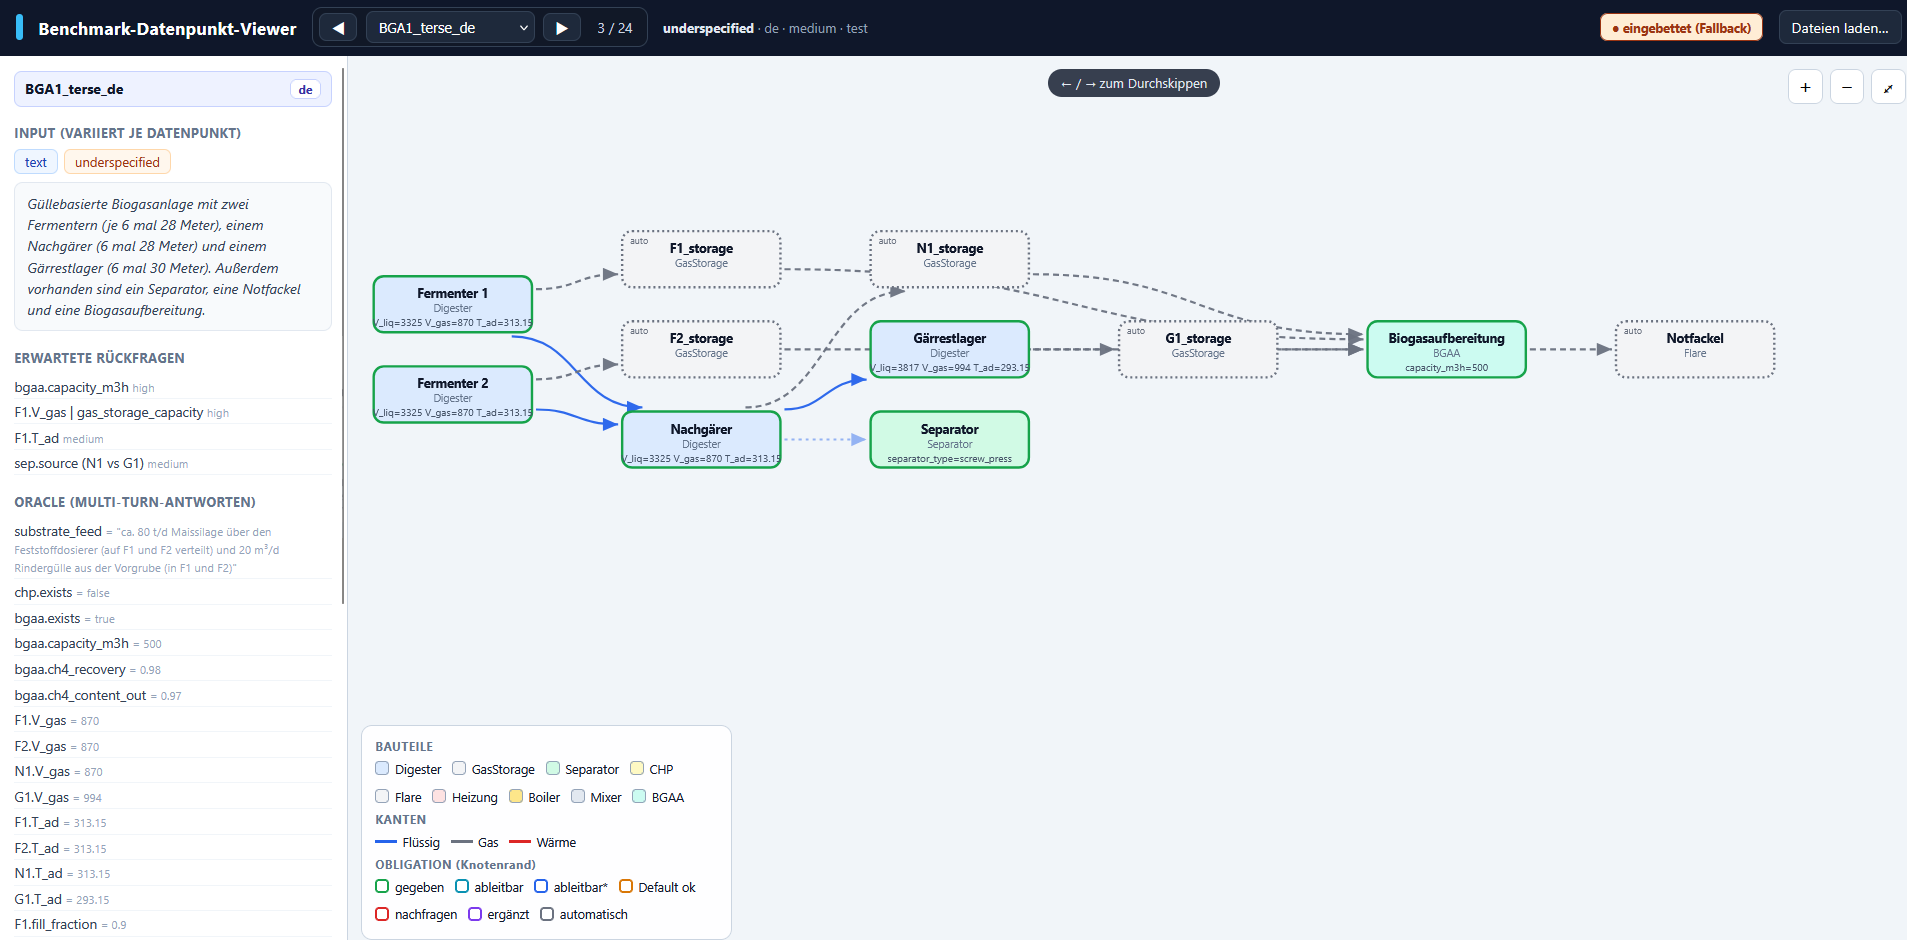
The viewer (benchmark/viewer/index.html) shows each data point
interactively (the input, the oracle answers, metadata and the parameters of
every component). Ideal for exploring the dataset and understanding a plant. It runs
offline in the browser, with no server.
What the viewer shows
- Plant graph: components as nodes, connections as edges.
- Component details: a table of the simulated parameters, acceptance band and notes.
- Sidebar: the input, the expected follow-up questions, the oracle
answers, the "must not invent" prohibitions, the dropped (not simulated) parts and the metadata.
Legend (graph)
| Element | Meaning |
|---|---|
| Node color | component type (Digester, GasStorage, CHP, Flare, …) |
| Edge color / style | connection type: liquid · gas · heat |
| Node border | the component's obligation (given / derivable / may-be-asked / automatic) |
The legend in the lower-left of the viewer summarises the color coding.
Launching
You can run the viewer offline, but new changes to the dataset will not be shown. Alternatively, refresh the index file or start a local server to see changes directly in the viewer.
Offline
Double-clicking benchmark/viewer/index.html opens the viewer directly (file://).
It then shows an embedded copy of the data points. Use Load files… to open
arbitrary data point JSONs manually.
Live mode
Always shows the current dataset; changes appear after a reload.
Then open in the browser: http://localhost:8000/benchmark/viewer/
Controls
| Action | Control |
|---|---|
| Previous / next data point | ◀ / ▶ buttons or arrow keys ←/→ |
| Show component details | click a node in the graph |
| Zoom | + / − / ⤢ buttons or mouse wheel |
| Open your own data points | Load files… (one or more .json) |
After changing the dataset
If you added or changed data points, regenerate the index:
More about the dataset and the evaluation scripts is in Using the Dataset.